
Equivalent Source processing, also known as the Equivalent Source Method (ESM) or Equivalent Layer technique, is a geophysical data processing and interpretation method used in potential field geophysics. It is primarily applied to magnetic and gravity data to model and interpret subsurface geological structures and density variations.
The concept behind the Equivalent Source processing is to represent the observed magnetic or gravity anomalies as if they were produced by a set of hypothetical point sources or “equivalent sources” located at a certain depth beneath the Earth’s surface. These equivalent sources mimic the observed anomalies, and by determining their distribution, depth, and strength, geophysicists can infer information about the subsurface geology.
An alternating or transient electrical current in a conductive medium in the presence of a time-varying magnetic field. The eddy current generates its own electromagnetic field.
Gravity gradiometers are instruments which measure the spatial derivatives of the gravity vector. The most frequently used and intuitive component is the vertical gravity gradient, Gzz, which represents the rate of change of vertical gravity (gz) with height (z). It can be deduced by differencing the value of gravity at two points separated by a small vertical distance, l, and dividing by this distance. The two gravity measurements are provided by accelerometers which are matched and aligned to an extremely high level of accuracy.
There are several types of Lockheed Martin gravity Full Tensor Gravity Gradiometers (FTG) currently in operation: the 3D Integrated Full Tensor Gravity Gradiometer (iFTG) and the Enhanced Full Tensor Gravity Gradiometer (eFTG) are exclusive to Metatek.
Substantial improvements in terms of instrument sensitivity and noise performance have more recently become available to industry in the form of an Enhanced Full-Tensor Gradiometer (eFTG). This full-tensor system is a scaled-up version of the FTG with increased sensitivity and lower noise to help resolve smaller and deeper geologic features. The initial Gzz noise performance of the eFTG was expected to be around 2.5 – 4 E/√Hz, but in commercial use, Metatek is often seeing noise levels around 2 E/√Hz during good flying conditions.
External Disturbance Fields are magnetic disturbance fields generated by electric currents flowing in the ionosphere and magnetosphere and “mirror-currents” induced in the Earth and oceans by the external magnetic field time variations. The disturbance field, which is associated with diurnal field variations and magnetic storms, is affected by solar activity (solar wind), the interplanetary magnetic field and the Earth’s magnetic field.
The external magnetic field exhibits variations on several time scales, which may affect the applicability of magnetic reference models. Very long-period variations are related to the solar cycle of about 11 years. Short-term variations result from daily changes in solar radiation, atmospheric tides and conductivity. Irregular time variations are influenced by the solar wind. Perturbed magnetic states, called magnetic storms, occur and show impulsive and unpredictable rapid time variations.
The Equipotential Method is a technique to map a potential field generated by stationary electrodes by moving an electrode around the survey area.
Equipotential methods involve mapping equipotential lines that result from a current. Distortions from a systematic pattern indicate the presence of a body of different resistivity. The mise-a-la-masse or ‘charged body potential’ method involves putting one current electrode in an ore body to map its shape and location.
The unit of gravity gradient is the eotvos (abbreviated as E). The eotvos is defined as 10−9galileos per centimetre. A person walking past at a distance of 2 metres would provide a gravity gradient signal of approximately one E. In SI units or in cgs units, 1 eotvos = 10−9 second−2 . Large physical bodies such as mountains can give signals of several hundred Eotvos. The eotvos unit is named for the Hungarian physicist Baron Loránd Eötvös de Vásárosnamény, who made pioneering studies of the gradient of the Earth’s gravitational field.
The Lockheed Martin Enhanced Full Tensor Gravity Gradiometer (eFTG) is the 4th generation and worlds most advanced moving-base gravity gradiometer, possessing a noise floor about three times lower than the Full Tensor Gradiometer (FTG) and providing data with higher bandwidth. This instrument has been used in geophysical surveys since 2022 and is exclusive to Metatek.
These improvements mean eFTG data have increased accuracy and higher spatial resolution, therefore widening the range of geological targets that can be mapped with gravity gradiometry.
The eFTG system combines the best design elements of previous gradiometers, essentially comprising three digital partial tensor discs/GGIs mounted in an FTG configuration. This means the eFTG GGIs have eight accelerometers per disc with a measurement baseline roughly double that of the FTG accelerometer separation. The increase in accelerometer count and larger baseline means the eFTG has a threefold improvement in S/N over the entire bandwidth. With 24 accelerometers the eFTG provides 12 gravity gradient outputs per measurement location (the eFTG essentially measures the full tensor twice and with double the accuracy in each case).

The Advanced Gravity Measurement Assemblage (AGMA) is an integral part of the eFTG instrument design and measures Scalar Gravity. The design of the AGMA is such that the gravimeter is located on the same stabilised platform as the gradiometer, meaning that the measurements are all on the same axis.
With its increased capability and performance, the eFTG benefits apply throughout the entire geological section, helping to deliver a more accurate Earth model. The greater sensitivity of the instrument allows the detection of smaller geological features with subtler density contrasts and improves the application of mapping structure in deeper basins. Surveys can be done more cost-effectively since the increased S/N means that the line spacing can be increased in some geological scenarios. The higher bandwidth and increased spatial resolution of data means these data can be more tightly integrated with seismic data than before; applications include joint gravity-seismic inversions and the ability to quality-control and refine seismic velocities. eFTG data also can be used ahead of a seismic survey, providing a highly detailed map on which to precisely locate seismic lines in the optimal locations.
The EGG was an evolution of technology originally developed for the European Space Agencyand was later developed by ARKeX (a corporation that is now defunct). It used two key principles of superconductivity to deliver its performance: the Meissner effect, which provides levitation of the EGG proof masses and flux quantization, giving the EGG its inherent stability. The EGG was specifically designed for high dynamic survey environments but was never deployed in commercial operations.
This is the gravity gradiometer deployed on the European Space Agency’s Gravity Field and Steady-State Ocean Circulation Explorer (GOCE) mission. It is a three-axis diagonal gradiometer based on three pairs of electrostatic servo-controlled accelerometers.
The ETC is a time-varying correction applied to gravity data to compensate for Earth tides. ETC is included as a part of the Drift Correction and referred to as Tidal Corrections.
Earth tides are a time – varying response of the solid Earth’s surface to the tidal influences of the moon and sun. Earth tides can produce displacement up to about 10cm and generate an anomaly of about 0.2-0.3 mGal. The magnitude of Earth tides depends on latitude and time.
Edge Effects are distortions of data which appear at the edges of grid images after applying filter operators or other grid, or line transformations. Assigning Taper or applying Data Extension and Edge Smoothing Filters allows Edge Effects to be minimized.
A pre-survey study to assess the suitability of geophysical techniques to achieve the survey objectives. Different platforms, instruments, terrain line spacing etc. can be considered. Metatek’s feasibility studies usually take the form of a 2D section(s) developed into a full 3D earth model, to allow a realistic, simulated survey response to be calculated.
The term “Figure of Merit” (FOM) is used in various fields to quantify the performance, quality, or effectiveness of a particular system, process, or measurement. It is a numerical value or metric that provides an objective way to compare different alternatives, evaluate the efficiency of a system, or assess the success of an operation.
In geophysical exploration, FOM is employed to assess the success of surveys or measurements. For instance, in geophysical data processing, the FOM may be used to evaluate the signal-to-noise ratio or the resolution of the data.
In geophysics, the Free-air Gravity Anomaly, often simply called the Free-air Anomaly, is the measured gravity anomaly after a free-air correction is applied to account for the elevation at which a measurement is made. It does so by adjusting the measurements of gravity to what would have been measured at a reference level, which is commonly taken as mean sea level or the Geoid.
In the case of gravity and magnetic airborne surveying, a line plan is a survey design used to minimise terrain clearance throughout the survey area of interest (AOI). It is important in gravity surveying in particular to try to acquire data as close to the ground as is possible after taking into account all safety considerations. Typically, surveys are planned for a 120m constant flight height, but the actual terrain clearance in hilly or mountainous areas will be higher. To achieve the optimal survey line plan in areas with topography, a 3D Drape Analysis is undertaken which allows for a more flexible acquisition footprint to achieve the optimal terrain clearance within the constraints of the topography. The main survey transact lines are known as Cross Lines and Tie Lines are also planned for and are primarily used to level magnetics and long wavelength gravity data from the AGMA.
Forward modelling in 2D is a widely used and a critical method to integrating potential field and seismic data. It is a convenient method to identify sources of anomalies where constraints exist. It also allows any number of simple model scenarios to be tested.
In physics, the Fourier transform (FT) is a transform that converts a function into a form that describes the frequencies present in the original function. The output of the transform is a complex-valued function of frequency. The term Fourier transform refers to both this complex-valued function and the mathematical operation. When a distinction needs to be made, the Fourier transform is sometimes called the frequency domain representation of the original function.
The Fourier analysis of gravity data is a geophysical data processing technique used to analyse and interpret gravity data obtained from gravity surveys. Fourier analysis is a mathematical method that decomposes complex functions or data sets into a series of simple sinusoidal functions, known as sine and cosine functions. In the context of gravity data, Fourier processing involves transforming the gravity measurements from the spatial domain (latitude, longitude, and elevation) to the frequency domain using Fourier transforms. Fourier analysis is particularly useful for detecting anomalies associated with geological features, such as faults, salt domes, or mineral deposits, which exhibit distinct spatial frequency patterns in the gravity field.
To ensure the accuracy and reliability of the data collected during airborne geophysical surveys, flight calibrations are performed before and after each survey flight. Flight calibrations involve various procedures to establish baseline measurements, account for instrument drift, and validate the data quality.
Full Tensor Gradiometers measure the rate of change of the gravity vector in all three perpendicular directions giving rise to a Gravity Gradient Tensor.
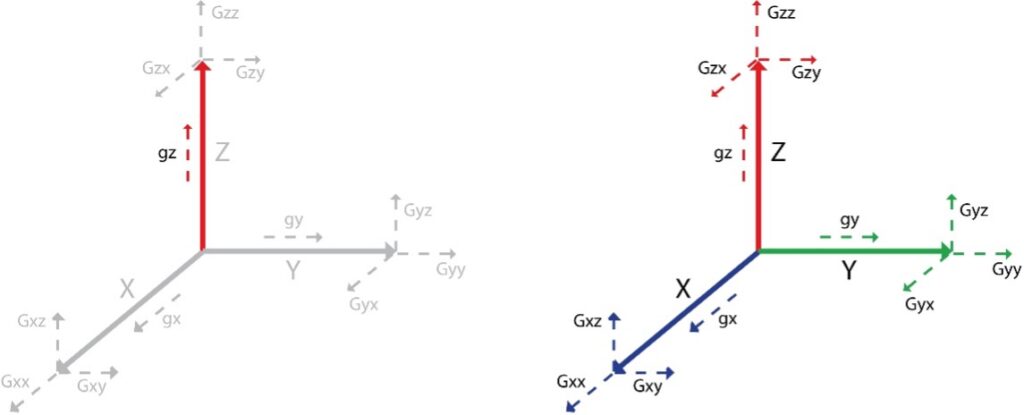
Conventional gravity measures ONE component of the Gravity Field in the Vertical Direction (Gz) (LHS), Full tensor gravity gradiometry measures ALL components of the gravity field (RHS)
Gravity gradiometry is a well-established geophysical technique that is often used in the search for natural resources and potential sites for CCS. The technology measures small differences in the Earth’s gravity field associated with changes in subsurface geology.
Lockheed Martin is the only company to provide commercial moving-base gravity gradiometers and, until 2020, broadly offered two types of gravity gradiometer to the exploration industry: the full-tensor gravity gradiometer (FTG) system, which is deployed in both airborne and marine modes, and the partial tensor system, typically deployed in airborne mode only. By their intrinsic design, these systems have a greatly improved resolution when compared to conventional (scalar) gravimeters and thus provide a natural advantage when used in exploration. In 2020, the Enhanced Full Tensor Gravity Gradiometer (eFTG) which is the 4th generation and most advanced system was developed. This system is used exclusively by Metatek.
In addition, geoscientists can benefit from having multidirectional gravity gradients as they yield extra information on geometrical and density changes in subsurface geology that give rise to gravity anomalies. Historically, these gravity gradiometers have been widely used in a variety of geological settings to rapidly screen petroleum basins and assist with the mapping of basin architecture, basement depth, faults and intra-sedimentary structure. They can also be used in mineral exploration and the search for renewables such as sites for geothermal energy development.
The fluxgate magnetometer was invented by H. Aschenbrenner and G. Goubau in 1936. A team at Gulf Research Laboratories led by Victor Vacquier developed airborne fluxgate magnetometers to detect submarines during World War II and after the war confirmed the theory of plate tectonics by using them to measure shifts in the magnetic patterns on the sea floor.
A fluxgate magnetometer consists of a small magnetically susceptible core wrapped by two coils of wire. An alternating electric current is passed through one coil, driving the core through an alternating cycle of magnetic saturation.
This constantly changing field induces a voltage in the second coil which is measured by a detector. In a magnetically neutral background, the input and output signals match. However, when the core is exposed to a background field, it is more easily saturated in alignment with that field and less easily saturated in opposition to it. Hence the alternating magnetic field and the induced output voltage, are out of step with the input current. The extent to which this is the case depends on the strength of the background magnetic field. Often, the signal in the output coil is integrated, yielding an output analogue voltage proportional to the magnetic field.
A wide variety of sensors are currently available and used to measure magnetic fields. Fluxgate compasses and gradiometers measure the direction and magnitude of magnetic fields. Fluxgates are affordable, rugged and compact with miniaturization recently advancing to the point of complete sensor solutions in the form of IC chips. This, plus their typically low power consumption makes them ideal for a variety of sensing applications. Fluxgate Gradiometers are commonly used for archaeological prospecting and unexploded ordnance (UXO) detection.
A free water gravity anomaly is obtained with the use of the Towed Deep Ocean Gravimeter and corrected for the free-water gradient, latitude effect, vertical acceleration, Eotvos effect and solid-earth tides.
A geographic information system (GIS) consists of integrated computer hardware and software that store, manage, analyse, edit, output, and visualise geographical data (usually geospatial in nature: GPS, remote sensing, etc.) The core of any GIS is a spatial database that contains representations of geographical phenomena, modelling their geometry (location and shape) and their properties or attributes. A GIS database may be stored in a variety of forms, such as a collection of separate data files or a single spatially enabled relational database.
Geophysics is a branch of natural science concerned with the physical processes and physical properties of the Earth and the use of quantitative methods for its analysis. Geophysicists, who usually study geophysics, physics, or one of the earth sciences at the graduate level, complete investigations across a wide range of scientific disciplines. The term geophysics classically refers to solid earth applications: Earth’s shape; its gravitational, magnetic fields, and electromagnetic fields; its internal structure and composition.
Gravity forward modelling (GFM) is the Computation of the gravity field of some given mass distribution. Forward Modelling of gravity is a technique used in geophysics to predict the gravitational field produced by subsurface structures or distributions of mass. This method is employed to understand the subsurface composition and geological features by simulating how gravity behaves due to various subsurface arrangements.
The unit of gravity gradient is the eotvos (abbreviated as E), which is equivalent to 10−9 s−2 (or 10−4 mGal/m). A person walking past at a distance of 2 metres would provide a gravity gradient signal of approximately one E. Large physical bodies such as mountains can give signals of several hundred Eotvos.
An instrument used to measure the acceleration due to gravity, or, more specifically, variations in the gravitational field between two or more points. The change from calling a device an “accelerometer” to calling it a “gravimeter” occurs at approximately the point where it has to make corrections for earth tides.
Gravity measurements are a reflection of the earth’s gravitational attraction, its centripetal force, tidal accelerations due to the sun, moon, and planets, and other applied forces.
Horizontal and Vertical Gradients, and Filters based on them such as the analytic signal, tilt angle, theta map and so on, as edge detection play an important role in the interpretation and analysis of gravity field data. Normalised Derivatives methods are used to equalise signals from sources buried at different depths.
Gravity Gradiometry is the study and measurement of variations (anomalies) in the Earth’s gravity field.
Gravity gradiometers are instruments which measure the spatial derivatives of the gravity vector. The most frequently used and intuitive component is the vertical gravity gradient, Gzz, which represents the rate of change of vertical gravity (gz) with height (z). It can be deduced by differencing the value of gravity at two points separated by a small vertical distance, l, and dividing by this distance. The two gravity measurements are provided by accelerometers which are matched and aligned to an extremely high level of accuracy. Metatek uses the latest generation Lockheed Martin Gravity Gradiometers.
The Gravity Gradient Tensor is the spatial rate of change of gravitational acceleration; as acceleration is a vector quantity, with magnitude and three-dimensional direction. The full gravity gradient is a 3×3 tensor.
Three-dimensional gravity inversion is an effective way to extract subsurface density distribution from gravity data. Machine-learning-based inversion is a newer data-driven method for mapping the observed data to a 3D model.
The Global Positioning System (GPS) is a satellite-based radio navigation system owned by the United States government and operated by the United States Space Force. It is one of the Global Navigation Systems (GNSS) that provides geolocation and time information to a GPS receiver anywhere on or near the Earth where there is an unobstructed line of sight to four or more GPS satellites.
It does not require the user to transmit any data, and operates independently of any telephonic or Internet reception, though these technologies can enhance the usefulness of the GPS positioning information. It provides critical positioning capabilities to military, civil, and commercial users around the world. Although the United States government created, controls and maintains the GPS system, it is freely accessible to anyone with a GPS receiver.
Ground-penetrating radar GPR is a geophysical method that uses radar pulses to image the subsurface. It is a non-intrusive method of surveying the sub-surface to investigate a variety of media, including rock, soil, ice, fresh water, and man-made structures. In the right conditions GPR can be used to detect subsurface objects, changes in material properties, and voids and cracks.
Individual lines of GPR data represent a sectional (profile) view of the subsurface. Multiple lines of data systematically collected over an area may be used to construct three-dimensional or tomographic images. Data may be presented as three-dimensional blocks, or as horizontal or vertical slices. Horizontal slices (known as “depth slices” or “time slices”) are essentially planview maps isolating specific depths.
The GOCE was the first of the European Space Agency’s (ESA’s) Living Planet Programme heavy satellites intended to map in unprecedented detail the Earth’s gravity field. The spacecraft’s primary instrumentation was a highly sensitive gravity gradiometer consisting of three pairs of accelerometers which measured gravitational gradients along three orthogonal axes known as the Gravitec gravity gradiometer.
Launched in 2009, GOCE mapped the deep structure of the Earth’s mantle and probed hazardous volcanic regions. By combining the gravity data with information about sea surface height gathered by other satellite altimeters, scientists were able to track the direction and speed of geostrophic ocean currents. The low orbit and high accuracy of the system greatly improved the known accuracy and spatial resolution of the geoid (the theoretical surface of equal gravitational potential on the Earth). The satellite began dropping out of orbit and made an uncontrolled re-entry on 11 November 2013.
A gyroscopic or inertial platform is a system using gyroscopes to maintain a platform in a fixed orientation in space despite the movement of the vehicle that it is attached to. These can then be used to stabilise sensitive instruments. See Stabilised or Inertial Platform for context in FTG surveying.
Geothermal energy is thermal energy extracted from the Earth’s crust. It combines energy from the formation of the planet and from radioactive decay. Geothermal energy has been exploited as a source of heat and/or electric power for millennia.
Geothermal heating, using water from hot springs, for example, has been used since Roman times. Geothermal power, (generation of electricity from geothermal energy), has been used since the 20th century. Unlike wind and solar energy, geothermal plants produce power at a constant rate, without regard to weather conditions. Geothermal resources are theoretically more than adequate to supply humanity’s energy needs. Most extraction occurs in areas near tectonic plate boundaries and often associated with volcanism.
The cost of generating geothermal power decreased by ~25% during the 1980s and 1990s. Technological advances have continued to reduce costs and thereby expand the amount of viable resources. As of 2010, geothermal electricity has been generated in over 26 countries.
Metatek has been flying geophysical surveys to help identify areas suitable for Geothermal energy development using eFTG technology for both Governments and for energy companies.
The Geoid is the shape that the ocean surface would take under the influence of the gravity of Earth, including gravitational attraction and Earth’s rotation if other influences such as winds and tides were absent. This surface is extended through the continents (such as with very narrow hypothetical canals) and can be defined on land as the surface which the ocean water would assume if it could reach its own level everywhere.
Gauss described it as the “mathematical figure of the Earth”, a smooth but irregular surface whose shape results from the uneven distribution of mass within and on the surface of Earth. It can be known only through extensive gravitational measurements and calculations. Despite being an important concept for almost 200 years in the history of geodesy and geophysics, it has been defined to high precision only since advances in satellite geodesy in the late 20th century.
The Geoid surface is irregular, unlike the Reference Ellipsoid (which is a mathematical idealised representation of the physical Earth as an ellipsoid) but is considerably smoother than Earth’s physical surface. Although the “ground” of the Earth has excursions on the order of +8,800 m (Mount Everest) and −11,000 m (Marianas Trench), the geoid’s deviation from an ellipsoid range from +85 m (Iceland) to −106 m (southern India), less than 200 m total.
If the ocean were of constant density and undisturbed by tides, currents or weather, its surface would resemble the geoid. The permanent deviation between the geoid and mean sea level is called Ocean Surface Topography.
An excellent source of existing global gravity field models and their visualisation is provided by the ICGEM (https://icgem.gfz-potsdam.de/home) which is one of five services coordinated by the International Gravity Field Service (IGFS) of the International Association of Geodesy (IAG).

The K-index, and by extension the Planetary K-index, was introduced by Julius Bartels in 1938. The indexes are used to characterise the magnitude of geomagnetic storms. Kp is an excellent indicator of disturbances in the Earth’s magnetic field and is used by organisations such as the US Space Weather Prediction Centre (SWPC) to decide whether geomagnetic alerts and warnings need to be issued for users who are affected by these disturbances.
The estimated Planetary K-index operates on a scale from 0-9 with 1 being calm and 5 or more indicating a geomagnetic storm and is updated every minute. The Estimated 3-hour Planetary Kp-index is derived at the NOAA SWPC using data from ground-based magnetometer sites throughout North America, UK, Germany, and Australia. These data are made available through cooperation between the SWPC and data providers around the world, which currently includes the U.S. Geological Survey (USGS), Natural Resources Canada (NRCAN), the British Geological Survey (BGS), the German Research Centre for Geosciences (GFZ), and Geoscience Australia (GA).
The principal users affected by geomagnetic storms are electrical power grid generators, space program operators, users of radio signals that reflect off or pass through the ionosphere, and users of GPS systems, including airborne survey companies.
Karst is a type of topography formed in areas of widespread carbonate rocks such as limestone, dolomite, and gypsum through dissolution. It is characterized by features like poljes above and drainage systems with sinkholes and caves underground.
Subterranean drainage may limit surface water, with few to no rivers or lakes. In regions where the dissolved bedrock is covered (perhaps by debris) or confined by one or more superimposed non-soluble rock strata, distinctive karst features may occur only at subsurface levels and can be totally missing above ground.
The study of paleokarst (buried karst in the stratigraphic column) is important in petroleum geology because as much as 50% of the world’s hydrocarbon reserves are hosted in carbonate rock, and much of this is found in porous karst systems. Paleokarst can often be detected by Gravity surveys.
Kriging is a statistical technique used with variograms, or two-point statistical functions that describe the increasing difference or decreasing correlation between sample values as separation between them increases, to determine the value of a point in a heterogeneous grid from known values nearby.
The theoretical basis for the method was developed by the French mathematician Georges Matheron in 1960, based on the thesis of Danie G. Krige, the pioneering plotter of distance-weighted average gold grades at the Witwatersrand reef complex in South Africa. Though computationally intensive in its basic formulation, kriging can be scaled to larger problems using various approximation methods.
Although kriging was developed originally for applications in geostatistics, it is a general method of statistical interpolation and can be applied within any discipline to sampled data from random fields that satisfy the appropriate mathematical assumptions. It can be used where spatially related data has been collected (in 2-D or 3-D) and estimates of “fill-in” data are desired in the locations (spatial gaps) between the actual measurements.
Kriging has been used in a variety of disciplines, including environmental science, hydrogeology, mining, natural resources, remote sensing and the prediction of oil production curves for shale oil wells.
Keating’s method utilizes a simple pattern recognition technique to locate magnetic anomalies that resemble the response of a modelled kimberlite pipe.
The magnetic response of a vertically dipping cylinder is computed in grid form. The model parameters that may be adjusted, include the depth, radius and length of the cylinder, the local magnetic inclination and declination, and the spatial extent of the anomaly. The model grid is then passed over a grid of total magnetic intensity as a “moving window”. The correlation between modelled and observed data is computed at each grid node using a first-order regression and then archived. The correlation coefficients that exceed a specific threshold (e.g., 75%) are retained for comparison to the magnetic and other exploration data.
A Kimberlite Pipe is a carrot or mushroom shaped, more of less vertical magmatic intrusion originating a depth (~150km), which sometimes contains diamonds. It is named after the town of Kimberley in South Africa, where the discovery of an 83.5-carat (16.70 g) diamond called the Star of South Africa in 1869 spawned a diamond rush and the digging of the open-pit mine called the Big Hole.
The morphology of kimberlite pipes and their classical carrot shape is the result of explosive diatreme volcanism from very deep mantle-derived sources. These volcanic explosions produce vertical columns of rock that rise from deep magma reservoirs. The eruptions forming these pipes fracture the surrounding rock as it explodes, bringing up unaltered xenoliths of peridotite to surface. These xenoliths provide valuable information to geologists about mantle conditions and composition.
Kimberlites are peculiar igneous rocks because they contain a variety of mineral species with chemical compositions that indicate they formed under high pressure and temperature within the mantle. These minerals, such as chromium diopside (a pyroxene), chromium spinels, magnesian ilmenite, and pyrope garnets rich in chromium, are generally absent from most other igneous rocks, making them particularly useful as indicators for kimberlites.
The Koenigsberger ratio is the proportion of remanent magnetization relative to induced magnetization in natural rocks. It was first described by J.G. Koenigsberger. It is a dimensionless parameter often used in geophysical exploration to describe the magnetic characteristics of a geological body to aid in interpreting magnetic anomaly patterns.

| Q | Königsberger Ratio |
| remanent magnetization | |
| induced magnetization | |
| χ | the magnetic susceptibility; the influence of an applied magnetic field on a material |
| H | the macroscopic magnetic field |
The total magnetization of a rock is the sum of its natural remanent magnetization and the magnetization induced by the ambient geomagnetic field. Thus, a Koenigsberger ratio, Q, greater than 1 indicates that the remanence properties contribute the majority of the total magnetization of the rock.
The Koefoed Method is a 2D technique used for estimating the depth of a magnetic source. It relies on the horizontal distance between points 1/2 and 3/4 of the maximum anomaly value. In other words, it helps determination of the depth of a magnetic feature based on specific measurements from the magnetic field.
Laplacian Gridding is a technique used in potential field geophysics, to interpolate irregularly spaced data onto a regular grid. It is commonly applied in gravity and magnetic data processing, where irregularly spaced measurements are collected during airborne or ground-based surveys.
The Laplacian gridding method derives its name from the Laplacian Operator, which is a mathematical operator used to calculate the divergence or curvature of a scalar field. In the context of gridding, the Laplacian operator is applied to the irregularly spaced data to estimate the values at grid nodes.
LiDAR is a method for determining ranges by targeting an object or a surface with a laser and measuring the time for the reflected light to return to the receiver. LiDAR may operate in a fixed direction (e.g., vertical) or it may scan multiple directions, in which case it is known as LiDAR scanning or 3D laser scanning, a special combination of 3-D scanning and laser scanning. LiDAR has terrestrial, airborne, and mobile applications.
Airborne LiDAR is when a laser scanner, while attached to an aircraft during flight, creates a 3-D point cloud model of the landscape. This is currently the most detailed and accurate method of creating Digital Elevation Models.
Lockheed Martin Corporation (LHM) is an American aerospace, arms, defence, information security, and technology corporation operating worldwide. It was formed by the merger of Lockheed Corporation with Martin Marietta in March 1995. It is headquartered in the Washington, D.C. area in the US. They also manufacture the most advanced Gravity Gradiometers in the world.
During the 1970s, as an executive in the US Dept. of Defence, John Brett initiated the development of the gravity gradiometer to support the Trident 2 system. A committee was commissioned to seek commercial applications for the Full Tensor Gradient (FTG) system that was being deployed on US Navy Ohio-class Trident submarines designed to aid covert navigation. As the Cold War ended, the US Navy released the classified technology and opened the door for full commercialisation of the technology.
There are several types of Lockheed Martin gravity gradiometers currently in operation: the 3D Integrated Full Tensor Gravity Gradiometer (iFTG) and the Enhanced Full Tensor Gravity Gradiometer (eFTG); deployed in either a fixed wing aircraft or a vessel and the FALCON gradiometer (a partial tensor system rather than a full tensor system and deployed in a fixed wing aircraft or a helicopter).
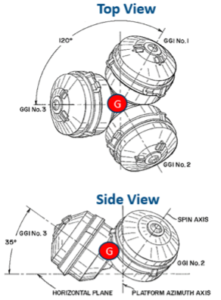
The 3D FTG system contains three Gravity Gradiometry Instruments (GGIs), each consisting of two opposing pairs of accelerometers arranged on a spinning disc with measurement direction in the spin direction. The full gravity gradient tensor is sensed by an Umbrella Configuration of three rotating Gravity Gradiometry Instruments (GGIs).
Larmor Signal is a signal generated by the proton-resonance of optically pumped magnetometer sensors, which is proportional to the intensity of an external magnetic field. An electronic console converts the Lamor Signal into values of the total magnetic intensity in nanoteslas (nT) using a gyromagnetic ratio.
A Latitude Correction is applied to observed gravity data to compensate for the increase of the gravitational acceleration (attraction) from the value of about 978000 mGal at the Equator to about 98300 mGal at the Poles due to a variation of the Earth’s radius because of polar flattening and variation of the centrifugal force resulting from the Earth’s rotation, as the distance to the Earth’s axis varies with latitude.
Levelling is a procedure of adjusting the survey data so that they tie at line intersections. In aeromagnetic surveys, levelling is a general term for a variety of procedures applied to the recorded magnetic data to correct for the main distorting effects of diurnal variations, positioning errors, and miss-ties between traverse and tie lines.
Line Corrugations are artificial anomalies elongated in the direction of the traverse and/or tie lines. Line Corrugations represent residual errors remaining after standard levelling of the observed potential field data. Line Corrugations are removed by applying microlevelling techniques.
Line Spacing is a distance in meters between traverse or tie lines of the survey. Distance between traverse lines is one of the most important parameters of the airborne survey. For mineral exploration, the traverse line spacing is derived mainly from the target size such as an ore body or Kimberlite Pipe and can be about 100-150m. For petroleum explorations, the traverse line spacing is estimated as a function of the depth of a target interval at which anomalies are expected to be resolved. Often, the basement depth is taken as the reference level for line spacing value estimates.
Local Gravity is a residual component of the gravity field. Often, local Gravity is Bouguer Gravity from which the estimated regional component has been subtracted.
The Local Regional Component is a spatial wavelength component of the observed potential field data which is larger than that of the dominant wavelengths of the target anomalies, but smaller than the spatial wavelengths of the order of the survey area extent.
The Nanotesla (nT; one nanotesla equals 10−9 tesla), is normally used as a measurement unit of the geomagnetic field. A nanotesla is equivalent to one gamma, a unit originally defined as 10−5 gauss, which is the unit of magnetic field in the centimetre-gram-second system.
Natural Remanent Magnetism is the magnetisation retained by rocks from previous magnetic fields. NRM is a record of the Earth’s magnetic field as it existed at the time that the rock formed, for example when magnetic crystals in igneous rocks solidified (also known as chemical remanent magnetism, CRM) or at the time of deposition of sedimentary rocks (known as depositional remanent magnetism, DRM). During deposition of sediments, magnetized particles can settle with their magnetic pole aligned with that of the Earth’s magnetic field at that time.
The nondipole (ND) field is that part of the internal geomagnetic field remaining after the major geocentric dipole contribution has been removed. It is distinct from the nonaxial‐dipole (NAD) field for which only the component of the geocentric dipole that is parallel to Earth’s rotation axis is subtracted.
Nuclear Magnetic Resonance is a phenomenon by which a nucleus absorbs electromagnetic radiation of a specific frequency in the presence of a strong magnetic field. First detected by Isidor Isaac Rabi (1898 to 1988), in 1938. Since then, magnetic resonance has been applied to the detection of light atoms (such as hydrogen in hydrocarbons) and as a non-destructive method to image the human body. NMR phenomena are also utilised in several types of magnetometers, including proton precession magnetometers (PPM) (also known as proton magnetometers), and Overhauser magnetometers.
Another use for nuclear magnetic resonance is data acquisition in the petroleum industry for oil and gas exploration and recovery. Initial research in this domain began in the 1950s, however, the first commercial instruments were not released until the early 1990s. A borehole is drilled into which NMR logging equipment is lowered. Nuclear magnetic resonance analysis of these boreholes is used to measure rock porosity, estimate permeability from pore size distribution and identify pore fluids (water, oil & gas). These instruments are typically low field NMR spectrometers.
The frequency of the normal, free oscillation or vibration of an entity or a system. The phenomenon of resonance occurs when a forced vibration matches a system’s natural frequency.
Free vibrations of an elastic body, also called natural vibrations, occur at the natural frequency. Natural vibrations are different from forced vibrations which happen at the frequency of an applied force (forced frequency). If the forced frequency is equal to the natural frequency, the vibrations’ amplitude increases manyfold. This phenomenon is known as resonance.[1] A system’s normal mode is defined by the oscillation of a natural frequency in a sine waveform.
In analysis of systems, it is convenient to use the angular frequency ω = 2πf rather than the frequency f, or the complex frequency domain parameter s = σ + ωi.
In a mass–spring system, with mass m and spring stiffness k, the natural angular frequency can be calculated as:
[ \omega_n = \sqrt{\frac{k}{m}} ]
where: (k) represents the spring stiffness (spring constant) in newtons per meter (N/m) and (m) represents the mass of the object attached to the spring in kilograms (kg).
The most common type of gravimeter used in exploration surveys is based on a simple mass-spring system.
The concept of “noise” plays a crucial role in the statistical analysis of data.
In geophysics and geology, seismic noise is a generic name for a relatively persistent vibration of the ground, due to a multitude of causes, that is often a non-interpretable or an unwanted component of signals recorded by seismometers.
Physically, seismic noise arises primarily due to surface or near surface sources and thus consists mostly of elastic surface waves. Low frequency waves (below 1 Hz) are commonly called microseisms and high frequency waves (above 1 Hz) are called microtremors. Primary sources of seismic waves include human activities, winds and other atmospheric phenomena, rivers, and ocean waves.
Seismic noise is relevant to any discipline that depends on seismology, including oil exploration, hydrology, earthquake engineering, and structural health monitoring. Seismic noise is often a challenge for activities that are sensitive to extraneous vibrations, including earthquake monitoring and research and gravitational wave detectors.
Natural Hydrogen (also known as white hydrogen, geologic hydrogen or gold hydrogen), is hydrogen that is formed by natural processes (as opposed to hydrogen produced by industry). Natural Hydrogen has been identified in many source rocks in areas beyond the sedimentary basins where oil companies typically operate.
Sources of natural hydrogen include degassing of deep hydrogen from Earth’s crust and mantle, reaction of water with ultrabasic rocks (serpentinization), decomposition of hydroxyl ions in the structure of minerals and biological activity.
A number of companies and Governments are now taking the exploration for Natural Hydrogen seriously, and Metatek has been involved in these activities.
The Naudy method, proposed by Naudy in 1971, focuses on analysing profiles of magnetic field data. Depth to a dike or plate like source is estimated from the relating source body’s anomaly parameters such as half width or others. The Naudy Method option for manual calculations involves measuring the slope, amplitude and distance elements of the magnetic anomaly profile and looking for the best fit of obtained values to theoretical values calculated for vertical dikes. In this case, it is referred to as the Inflection Tangent Intersection (ITT) method.
The Nettleton Test is a geophysical method used to estimate the in-situ density of subsurface materials. It allows an evaluation of different values of the average rock density between Datum (usually sea level) and Station Elevation in order to select a ‘true’ value (i.e. Density Factor) for elevation correction.
Newton’s law of universal gravitation says that every particle attracts every other particle in the universe with a force that is proportional to the product of their masses and inversely proportional to the square of the distance between their centres. Separated objects attract and are attracted as if all their mass were concentrated at their centres. The publication of the law has become known as the “first great unification”, as it marked the unification of the previously described phenomena of gravity on Earth with known astronomical behaviours.
This is a general physical law derived from empirical observations by what Isaac Newton called inductive reasoning. It is a part of classical mechanics and was formulated in Newton’s work Philosophiæ Naturalis Principia Mathematica (“the Principia”), first published on 5 July 1687.
The equation for universal gravitation thus takes the form:
![]()
![]()
Where F is the gravitational force acting between two objects, m1 and m2 are the masses of the objects, r is the distance between the centres of their masses, and G is the gravitational constant.
NAD 83 (North American Datum 1983) is a geodetic reference system used to define the horizontal positions (latitude and longitude) of points on the Earth’s surface in North America. It serves as a common framework for mapping, surveying, and navigation. Geographic Information Systems (GIS) use NAD 83 as a standard reference for spatial data.
See Natural Remanent Magnetism.
North Seeking Pole is a positive pole of Magnetic Diploe which is attracted towards the Earth’s north magnetic pole.
A safety management system is designed to manage safety risk in the workplace, occupational safety being defined as the reduction of risk to a level that is as low as is reasonably practicable (ALARP) to prevent people getting hurt.
A SMS provides a systematic way to continuously identify and monitor hazards and control risks while maintaining assurance that these risk controls are effective. SMS can be defined as a businesslike approach to safety. It is a systematic, explicit and comprehensive process for managing safety risks. As with all management systems, a safety management system provides for goal setting, planning, and measuring performance. A safety management system is woven into the fabric of an organization. It becomes part of the culture, the way people undertake their jobs.
In physics, forces (as vectorial quantities) are given as the derivative (gradient) of scalar quantities named potentials. In classical physics pre-Einstein, gravitation was given in the same way, as consequence of a gravitational force (vectorial), given through a scalar potential field, dependent of the mass of the particles. Thus, Newtonian gravity is called a scalar theory. The gravitational force is dependent of the distance r of the massive objects to each other (more exactly, their centre of mass). Mass is a parameter and space and time are unchangeable. This is complicated!
In very simple terms, Scalar Gravity can be considered the vertical effect of gravity as opposed to the measurement of the gravity gradient away from its source.
Seismic methods utilise elastic energy created by natural and artificial sources to create an image of the subsurface. Seismic waves are recorded on geophones (receivers) . Seismic methods are split up into three different methods, reflection, refraction, and surface wave, based on the physical property of the waves being considered. The reflection method looks at reflected energy from sharp boundaries to determine contrasts in density and velocity. Controlled-source seismology is commonly used to map subsurface structure (faults, salt domes, anticlines and other geologic traps) in petroleum-bearing rocks.
2D Seismic tends to refer to a group of 2D seismic lines acquired individually, as opposed to the multiple closely spaced lines acquired together that constitute 3D seismic data.
Typical receiver line spacing in 3D seismic can range from 300m to over 600m and typical distances between shotpoints and receiver groups is 25m (offshore and internationally) and 34 to 67m (onshore USA). The resultant data set can be ‘cut’ or ‘sliced’ in any direction but still display a well sampled seismic section. The original seismic lines are called in-lines. Lines displayed perpendicular to in-lines are called crosslines. In a properly migrated 3D seismic data set, events are placed in their proper vertical and horizontal positions, providing more accurate subsurface maps than can be constructed on the basis of more widely spaced 2D seismic lines, between which significant interpolation might be necessary. 3D seismic data provides more detailed information about fault distribution and subsurface structures and nowadays is the primary dataset for determining where to drill for oil and gas accumulations.
The Shuttle Radar Topography Mission (SRTM) is an international research effort that obtained digital elevation models on a near-global scale from 56°S to 60°N, to generate the most complete high-resolution digital topographic database of Earth prior to the release of the ASTER GDEM in 2009.
SRTM consisted of a specially modified radar system that flew on board the Space Shuttle Endeavour during the 11-day STS-99 mission in February 2000.
The SRTM 3 or Version 3 (2013) dataset, also known as SRTM Plus, is void-filled with ASTER GDEM and USGS GMTED2010 and has been available in global 1-arcsecond (30 meter) resolution since 2014.
A Stabilised or Inertial Platform, also known as a Gyroscopic Platform, is a system using gyroscopes to maintain a platform in a fixed orientation in space despite the movement of the vehicle that it is attached to.
To allow an FTG to function optimally when being used in airborne surveys, it is very important to locate the instrument on an Aircraft Interface Platform (Stabilised or Inertial Platform). The Stabilised platform comprises a series of servo-driven nested gimbals. This is to minimise the rotational motion of the host aircraft which introduces ‘noise’ into the data. By doing this it is possible to minimise the aircraft motion’s influence on measurements.
Superconducting Quantum Interference Devices or SQUIDS measure extremely small changes in magnetic fields. They are very sensitive vector magnetometers, with noise levels as low as 3 fT Hz−½ in commercial instruments and 0.4 fT Hz−½ in experimental devices.
Many liquid-helium-cooled commercial SQUIDs achieve a flat noise spectrum from near DC (less than 1 Hz) to tens of kilohertz, making such devices ideal for time-domain biomagnetic signal measurements.
Geophysical surveys use SQUIDs from time to time, but the logistics of cooling the SQUID are much more complicated than other magnetometers that operate at room temperature.
A Salt Dome Gravity Anomaly is a large negative anomaly on the gravity profile or local closed minima zone on the gravity map. It is common that the uppermost portion of many salt domes (i.e. salt cap rock composed of anhydrite) has a higher density than that of the surrounding host sedimentary rock at the same depth. Thick salt cap rock (50-100m or more) can also create a lateral density contrast and therefore give rise to a small positive anomaly within the larger, negative Salt Dome Gravity Anomaly. Sometimes, gas chimney anomalies may look like a shallow Salt Dome Gravity Anomaly.
Satellite gravity refers to the gravitational field around the Earth that can be measured by satellites. satellites act as probes within Earth’s gravity field, allowing continuous and uninterrupted tracking. These measurements provide valuable information about changes in mass distribution, ocean circulation, glacial melt, and geodesy.
Satellite Gravity is a method, instrumentation and software to calculate gravity anomalies (i.e. Free-Air Gravity) over ocean basins from Satellite Altimetry data. Satellite Gravity is based on the fact that the Earth’s gravity field in marine areas is related to the equipotential shape of the sea surface, known as the Geoid, which can be measured by radar altimeters onboard orbiting satellites. These measurements are converted into the gravity anomalous field using various transform techniques. The resolving capacity of satellite gravity is estimated at approximately 3-7mGal and 20-30km in width. Satellite Gravity is also referred to as Satellite-Derived Gravity or Altimeter-Derived Gravity.

A milestone in the development of satellite gravimetry was the Williamstown conference. At the invitation of NASA, several handpicked space experts, geodesists, and earth scientists met in Williamstown (Massachusetts) in 1969 to formulate a future program entitled “Solid Earth and Ocean Physics—Applications of Space and Astronomic Techniques”.
Satellite Magnetics is a method and instrumentation to collect and process measurements of the Earth’s magnetic field by orbiting satellites, usually at an altitude of around 400km + above sea level. Caesium, Rubidium-Vapour and sometimes Fluxgate magnetometers are used for making Satellite Magnetic measurements. The resolution of Satellite Magnetics is usually in the order of 1-2nT.
The European Space Agency (ESA) initiated its first constellation mission for Earth Observation (EO) (Swarm) in 2013. The mission consists of three identical satellites named Alpha, Bravo, and Charlie (A, B and C); which were launched on 22 November 2013 into a near-polar orbit. Swarm is dedicated to creating a highly detailed survey of Earth’s geomagnetic field and its temporal evolution as well as the electric field in the atmosphere, by using a satellite constellation that carries sophisticated magnetometers and other instruments.
A Station is a ground position at which a Gravimeter or Magnetometer is configured for making measurements of the gravity or magnetic field. Station Spacing is the distance between two consecutive points of the gravity or magnetic field measurements along the survey line. Station Spacing should not be more than half the lateral extent of the smallest wavelength anomaly which is expected to be resolved with a planned survey design.
The universal gravitational constant, also known as the Newtonian constant of gravitation, or the Cavendish gravitational constant), denoted by the capital letter G, is an empirical physical constant involved in the calculation of gravitational effects in Sir Isaac Newton’s law of universal gravitation and in Albert Einstein’s theory of general relativity.
According to Newton’s law of universal gravitation, the magnitude of the attractive force (F) between two bodies each with a spherically symmetric density distribution is directly proportional to the product of their masses, m1 and m2, and inversely proportional to the square of the distance, r, directed along the line connecting their centres of mass:
![]()
![]()
The gravitational constant is a physical constant that is difficult to measure with high accuracy. This is because the gravitational force is an extremely weak force as compared to other fundamental forces at the laboratory scale.
Upward continuation is a method used in oil exploration and geophysics to estimate the values of a gravitational or magnetic field by using measurements at a lower elevation and extrapolating upward, assuming continuity. This technique is commonly used to merge different measurements to a common level to reduce scatter and allow for easier analysis.

